
Students
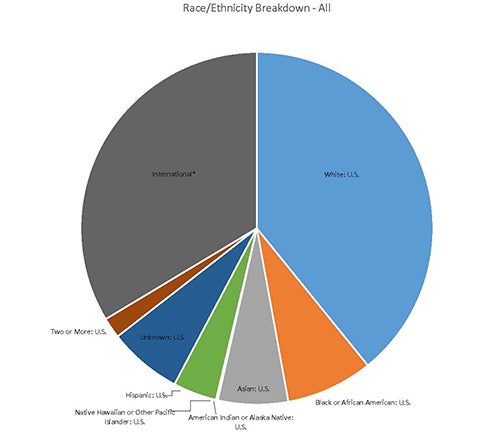
Graduate students comprise nearly one-third of the student population at the University of Maryland. In Fall 2016, the Graduate School enrolled 10,611 students, of which 38 percent were doctoral students, just under half were women, one-third were international students, and close to 21 percent were minorities, with an overall average age of 29. (See Campus Overview and Graduate Student Profile.)
FALL 2016
- Applications: 20,695
- Admissions: 8,427
- Enrollments: 3,549
TOTAL ENROLLMENT BY COLLEGE/SCHOOL
| COLLEGE/SCHOOL | FALL 2016 ENROLLMENT |
|---|---|
| A. James Clark School of Engineering | 2,165 |
| College of Agriculture & Natural Resources | 352 |
| College of Arts & Humanities | 887 |
| College of Behavioral & Social Sciences | 953 |
| College of Computer, Mathematical & Natural Sciences | 1,273 |
| College of Education | 860 |
| College of Information | 410 |
| Phillip Merrill College of Journalism | 58 |
| Robert H. Smith School of Business | 2,142 |
| School of Architecture, Planning, & Preservation | 239 |
| School of Public Health | 398 |
| School of Public Policy | 279 |
| Other (non-degree) | 595 |
| TOTAL | 10,611 |
TOTAL ENROLLMENT BY RACE AND ETHNICITY
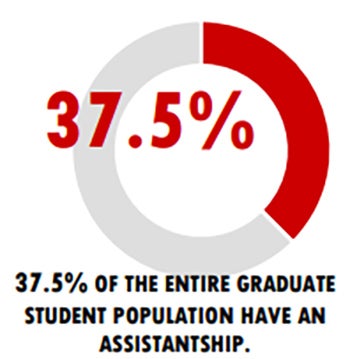
GRADUATE ASSISTANTSHIPS
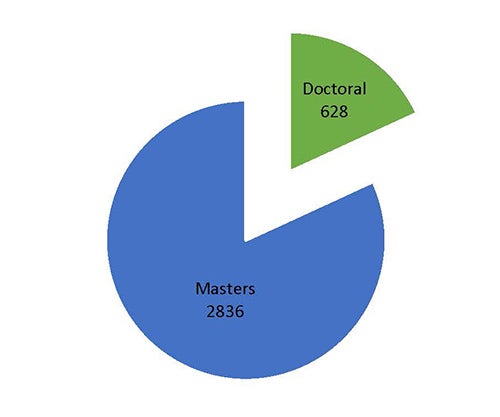
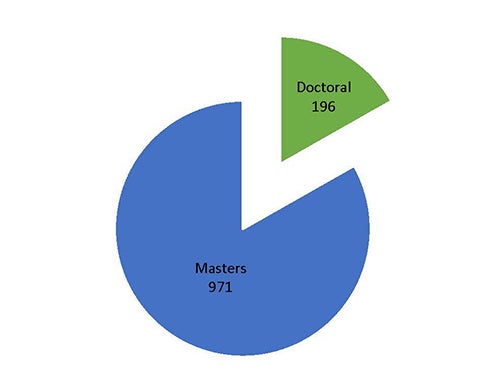
GRADUATE DEGREES AWARDED
TOP 5 DOCTORAL DEGREES AWARDED
- Electrical and Computer Engineering (PhD)
- Physics (PhD)
- Computer Science (PhD)
- Mechanical Engineering (PhD)
- Music: Non-Music Education (PhD)
TOP 5 MASTER'S DEGREES AWARDED
- Business Administration (MBA)
- Curriculum & Instruction (MEd)
- Master of Finance (MFIN)
- Accounting (MS)
- Public Policy (MPP)
- Applications: 7,641
- Admissions: 1,747
- New Enrollments: 735
DOCTORAL ENROLLMENT BY COLLEGE/SCHOOL
| COLLEGE/SCHOOL | FALL 2016 DOCTORAL STUDENT ENROLLMENT |
|---|---|
| A. James Clark School of Engineering | 868 |
| College of Agriculture & Natural Resources | 279 |
| College of Arts & Humanities | 592 |
| College of Behavioral & Social Sciences | 568 |
| College of Computer, Mathematical & Natural Sciences | 1,125 |
| College of Education | 379 |
| College of Information | 47 |
| Phillip Merrill College of Journalism | 28 |
| Robert H. Smith School of Business | 87 |
| School of Architecture, Planning, & Preservation | 28 |
| School of Public Health | 131 |
| School of Public Policy | 54 |
| TOTAL | 4,186 |
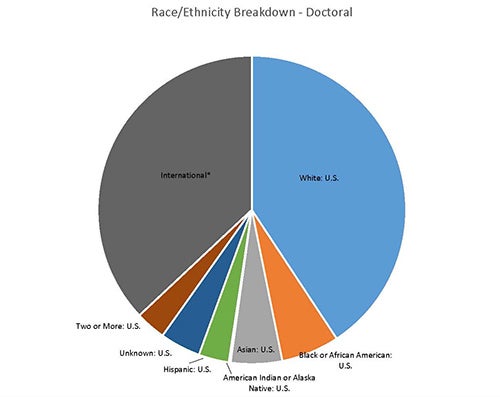
DOCTORAL ENROLLMENT BY RACE AND ETHNICITY
- Applications: 12,582
- Admissions: 6,264
- New Enrollments: 2,493
MASTER'S ENROLLMENTS BY COLLEGE
| COLLEGE/SCHOOL | FALL 2016 MASTER’S STUDENT ENROLLMENT |
|---|---|
| A. James Clark School of Engineering | 1,264 |
| College of Agriculture & Natural Resources | 73 |
| College of Arts & Humanities | 288 |
| College of Behavioral & Social Sciences | 346 |
| College of Computer, Mathematical & Natural Sciences | 146 |
| College of Education | 458 |
| College of Information | 354 |
| Phillip Merrill College of Journalism | 30 |
| Robert H. Smith School of Business | 2,055 |
| School of Architecture, Planning, & Preservation | 195 |
| School of Public Health | 256 |
| School of Public Policy | 225 |
| Other | 140 |
| TOTAL | 5,830 |
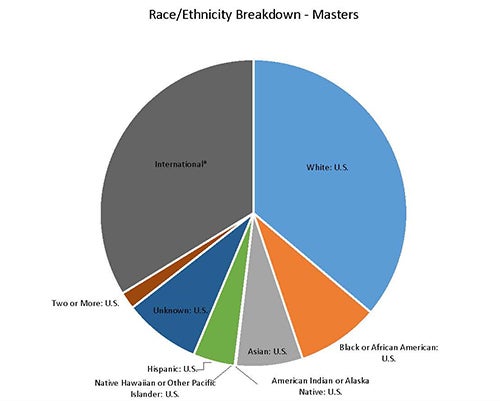
MASTER'S ENROLLMENT BY RACE AND ETHNICITY
- Applications: 11, 904
- Admissions: 4,152
- New Enrollments: 1,299
INTERNATIONAL ENROLLMENT BY COLLEGE/SCHOOL
| COLLEGE/SCHOOL | FALL 2016 INTERNTIONAL STUDENT ENROLLMENT |
|---|---|
| A. James Clark School of Engineering | 1,056 |
| College of Agriculture & Natural Resources | 94 |
| College of Arts & Humanities | 153 |
| College of Behavioral & Social Sciences | 246 |
| College of Computer, Mathematical & Natural Sciences | 533 |
| College of Education | 73 |
| College of Information | 129 |
| Phillip Merrill College of Journalism | 14 |
| Robert H. Smith School of Business | 1,082 |
| School of Architecture, Planning, & Preservation | 36 |
| School of Public Health | 42 |
| School of Public Policy | 64 |
| Other | 50 |
| TOTAL | 3,572 |
DEGREES AWARDED TO INTERNATIONAL STUDENTS
OTHER INTERNATIONAL FACTS
Top 5 countries (other than US) represented by Fall 2016 students (in order of enrollment):
- China
- India
- South Korea
- Iran
- Taiwan (R.O.C.)
Top 5 programs represented by Fall 2016 international students (in order of enrollment):
- Finance
- Accounting
- Electrical and Computer Engineering
- Telecommunications